

Group Org Chart Software: How Group HR Sees Every Subsidiary in One View
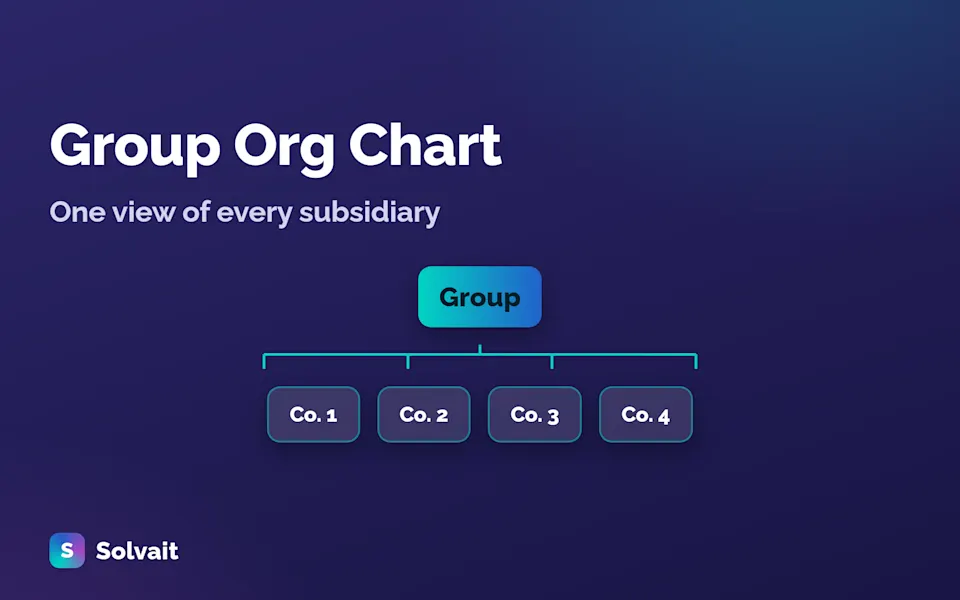
A group org chart is one live chart that brings every subsidiary into a single, current view. It shows reporting lines, positions, and headcount for each legal entity. Instead of each company keeping its structure in a separate file, group HR sees the whole organization from one place.
The familiar problem is that the chart on paper lags behind reality. People join, move, and leave. New departments appear. The file stays the same. And the more subsidiaries a group has, the wider the gap grows between what is drawn and what actually exists.
This article covers three things. Why org charts drift from reality in a group. What one unified chart across every subsidiary looks like. And what group HR gains from seeing the full picture, from workforce planning to staying inside the Saudization band of every establishment.
Key takeaways
A group org chart is one unified, always current view of every subsidiary, not a separate file per company.
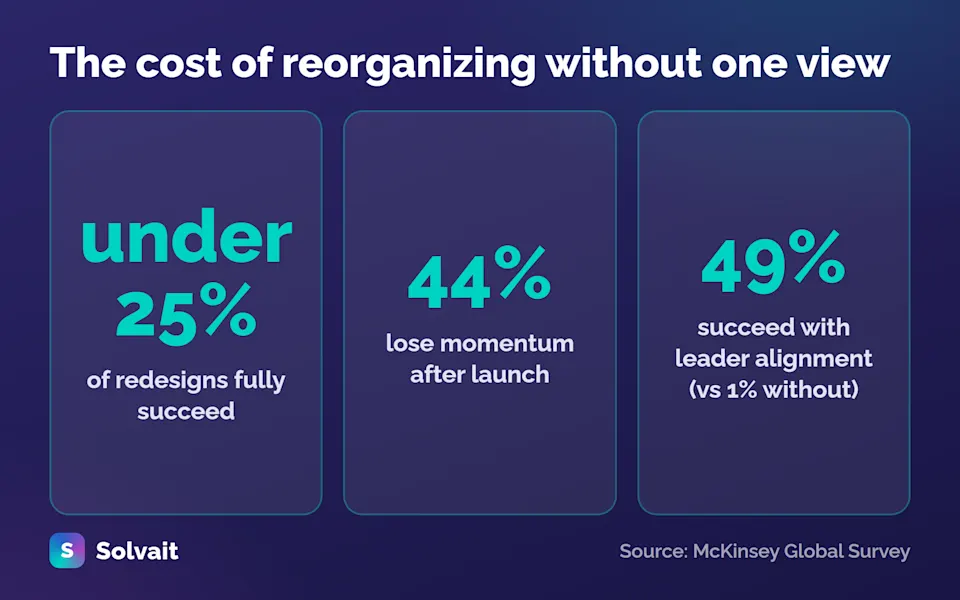
Fewer than a quarter of organizational redesigns fully succeed, and weak shared visibility is a leading cause (McKinsey).
In Saudi Arabia, the Saudization (Nitaqat) rate is assessed per establishment, so seeing each entity's structure is a compliance requirement.
A unified chart speeds reorganizations, exposes broken spans of control, and feeds goals and appraisals with correct data.
Solvait Wise consolidates every company's structure into one chart and links it to performance and goals.
Why do org charts drift from reality in a group?
The first reason is simple. Each subsidiary keeps its structure in its own file. An Excel sheet here, a PowerPoint chart there, a third HR system at another company. No one sees the group as a single whole.
The second reason is that updates are manual. The chart gets reviewed once a quarter or once a year, while reality changes every week. Between reviews, errors pile up. Someone transferred and was never moved on paper. A manager left, and the name stayed in the box.
This is not just an impression. In a survey of HR practitioners on workforce planning tools, data consolidation (49%) and data accuracy (47%) ranked as the top challenges, because position, employee, and finance data usually live in separate systems that need manual reconciliation before any planning (OrgChart, 2026).
When a reorganization comes, the cost shows up. McKinsey's global survey finds that fewer than a quarter of organizational redesigns fully succeed, and that 44% lose momentum after they get under way. One of the strongest success factors is a clear, shared picture that leaders agree on. Where leaders are fully aligned on the objectives, success rises to 49%. Where they are not, it drops to 1% (McKinsey).
Even the largest firms live this. In 2024, Deloitte itself ran its biggest reorganization in a decade, consolidating its business units from five to four. Restructuring is not the exception. It is part of the life of any group. The real question is whether HR sees it clearly before it starts.
Approach | A file per company | One unified org chart |
|---|---|---|
Data source | Scattered across files and systems | A single source for the group |
Updates | Manual, quarterly or yearly | With every change |
Group visibility | Fragmented, company by company | Full picture in one place |
Reorg readiness | Slow and error prone | Fast and reliable |
What does one unified org chart across subsidiaries look like?
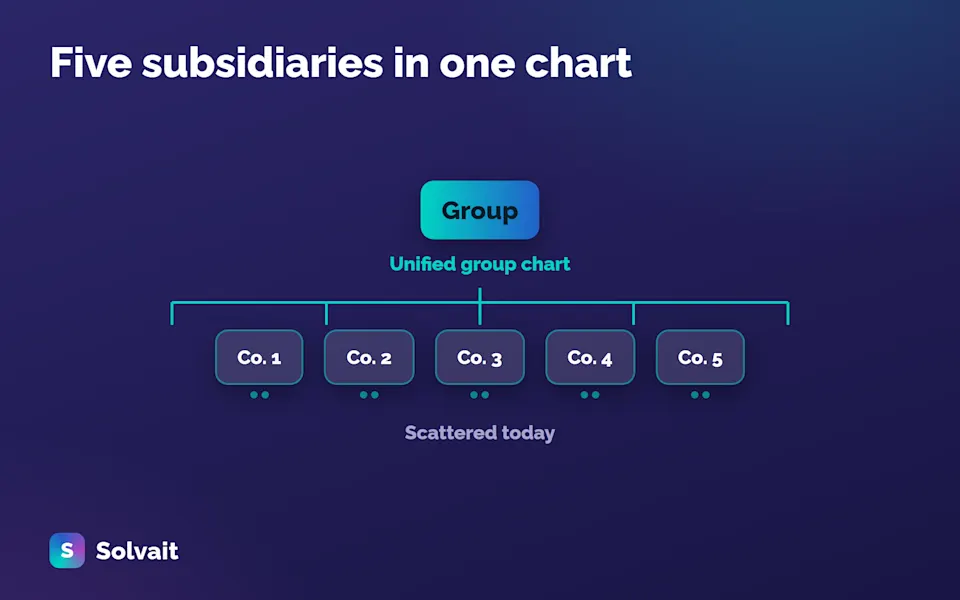
Picture a group with five subsidiaries. Today each company keeps its structure in a different file, and group HR holds five files that nothing connects. A unified chart untangles this. One tree, each company a branch, and under each branch its departments, teams, and people.
Inside that chart, four things show up for every entity:
Reporting lines: who reports to whom, across companies and not only inside one.
Positions and vacancies: what is filled and what is open in each department.
Headcount: the real size of each company and each department.
Dotted lines: matrix reporting, such as a finance manager in a subsidiary who reports functionally to the group.
The types of organizational structures here are rarely identical. One company may be functional, another divisional by sector, a third a matrix. A group is usually a mix of all three, and a unified chart holds them together instead of forcing one structure on everyone.
The payoff is that group HR reads each entity on its own, then reads the whole group, from the same screen:
What shows for each subsidiary | Why it matters |
|---|---|
Headcount and vacancies | Workforce planning and budget |
Span of control per manager | Spots teams that are too large or too small |
Saudization rate in the establishment | Nitaqat compliance per entity |
Reporting and matrix lines | Clear accountability before any decision |
What does group HR gain from the full picture?
Sharper workforce planning. When you see every company's headcount and vacancies in one place, you build the hiring plan and the budget on correct numbers, not estimates. Gartner warns that workforce planning built on inaccurate data fails and damages HR's credibility with business leaders (Gartner, 2025).
Control over span of control. A unified chart shows how many people report to each manager across companies. In Deloitte's research, the average span is about 9.7 reports per manager, and it rises at larger firms. When you can see one manager with two reports and another with twenty, you know where to rebalance.
Faster, safer reorganizations. A decision that starts from a clear picture is closer to success. We saw that leader alignment on a shared view lifts redesign success from 1% to 49% (McKinsey). The unified chart is that shared view.
Cleaner Saudization compliance. In Saudi Arabia, the Saudization rate in the Nitaqat program is calculated per establishment, by sector and size (Ministry of Human Resources and Social Development). A group that sees each entity's structure knows every establishment's band before it turns into a violation. For context, about 11.8 million people work in the Saudi private sector, roughly 2.4 million of them Saudi (GASTAT, 2024), so every hire in an entity touches its band.
Structure tied to performance and goals. When the chart is current, appraisal and goal cycles run on the real structure, not an old map. People are reviewed under their actual manager, and goals cascade down the correct reporting lines.
Common mistakes when consolidating structures
Keeping an Excel file per company, then trying to merge them by hand at year end.
Updating the chart only once a quarter, so a gap opens between it and reality.
Confusing the legal entity with the operating unit, which loses the correct Saudization rate per establishment.
Ignoring dotted lines, which makes accountability look simpler than it is in a real group.
Where Solvait Wise fits
Solvait Wise is an AI assisted insights platform for performance, goals, talent, and organizational structure. On this topic, it consolidates every subsidiary's structure into one chart and keeps it current as the data changes, so group HR sees the full picture instead of five scattered files.
Because the structure is connected to performance and goals inside the same platform, appraisal cycles run and goals cascade on the group's real structure. And people keep the decisions: the platform shows the picture and suggests, while HR decides. If you want to start with free tools, the HR tools gathers calculators and ready templates with no sign up, and the structure can later connect to Solvait Wise within the broader Solvait AI HR platform.
Solvait is the agentic AI HR company, founded in Riyadh in 2010, with 300+ clients and offices in Riyadh, Amman, and Cairo, certified to ISO 27001 for information security. Implementation typically goes live within 30 days.
Want to see every one of your companies in one current chart? Book a demo.
FAQ
What is a group org chart?
A group org chart is one unified, current view that brings every subsidiary together, showing reporting lines, positions, and headcount for each legal entity. It lets group HR see the whole structure from one place instead of a separate file per company, and it ties each entity to its own band and metrics.
How do I consolidate org charts across multiple subsidiaries?
Start with a single source of data instead of a file per company. Bring position, employee, and reporting data into one platform that shows the group as a single tree, and update it with every change rather than every quarter. That keeps headcount and the Saudization rate correct for each establishment and for the group together.
What is the difference between organizational structure and an org chart?
Organizational structure is how roles, responsibilities, and reporting lines are arranged in a company. An org chart is the visual representation of that structure as a tree. The structure is the design, and the chart is the picture that shows it to people.
How often should an org chart be updated?
Ideally with every real change: a hire, a transfer, a departure, or a new department. A quarterly update leaves a gap where errors accumulate between reviews. A chart connected to the HR system stays current automatically instead of relying on manual updates.
Does the org chart affect the Saudization (Nitaqat) rate?
Yes. The Saudization rate in the Nitaqat program is assessed per establishment, by sector and size. When a group sees each entity's structure and headcount clearly, it knows every establishment's band before any hiring decision, and it avoids letting one entity's gap become a violation.
References
McKinsey - The secrets of successful organizational redesigns: McKinsey Global Survey results (supports: fewer than a quarter fully succeed, 44% lose momentum, 1% vs 49% with leader alignment)
Gartner - Strategic Workforce Planning and data quality, 2025 (supports: planning on inaccurate data fails and damages HR credibility)
Deloitte - Organizational models: a network of teams, Human Capital Trends, 2016 (supports: average span of control about 9.7)
Deloitte - Deloitte launches largest global restructuring in a decade, 2024 (supports: even the largest firms restructure)
Ministry of Human Resources and Social Development - Developed Nitaqat program, (supports: Saudization rate assessed per establishment by sector and size)
OrgChart - State of Workforce Planning 2026, 2026 (industry survey, supports: data consolidation 49% and data accuracy 47% as top challenges)
See agentic HR in action
Solvait AI HR and its agents prepare Saudi labor-law work so HR can review it before anything is submitted.
Tags
Related Posts

Performance Appraisal Calibration: Why Ratings Differ
Two managers, same work, different scores-how performance appraisal calibration keeps every rating fair and defensible in Saudi Arabia.
Sep 29, 2026

AI Agentic HR: Smarter Hiring in the Gulf
How AI Agentic HR from managing operations to running them: faster hiring, attrition prediction and smart Saudization. A practical guide for Gulf leaders.
Jun 10, 2026
OKR Coverage %: Measure If Goals Ladder Up to Strategy
OKR coverage measures how many of your goals actually link to a company objective. Learn the formula, the healthy range, and how to fix orphan goals.
Oct 18, 2026