

Your Org Chart Is Telling You Everything. You Just Need to Read It
In most companies the org chart is an onboarding document. It gets opened when someone joins, then forgotten until the next restructure. Meanwhile it holds answers to questions the board keeps asking: why do decisions take so long, why does one department lose people faster than the rest, and why is one manager working 60 hour weeks while another is looking for something to do.
Three signals are enough to start with: span of control, the number of layers to the front line, and how work is distributed across departments. All three have been sitting in your data for years. Nobody read them because reading them by hand means weeks of spreadsheet work.
What organization structure analysis actually reads
Organization structure analysis is the practice of measuring a company's reporting relationships against defined benchmarks, then testing alternatives before moving anyone. Agentic AI changes the economics of it: an agent builds the map from your headcount data, measures it, and proposes scenarios with their expected effect, all under human oversight.
What you see in the chart | What it actually means | What you do |
A manager with 18 direct reports | No time to coach, review or develop anyone | Redistribute the team or add one specific layer |
A manager with two direct reports | A management layer with no management work | Merge the unit or return them to higher value delivery |
Seven layers from CEO to front line | A simple decision takes weeks | Remove a layer and delegate explicit authority in its place |
One department carrying double the load at the same headcount | Turnover arriving within months | Move the work before the resignations move it for you |
There's no magic number for span of control. Standardized, repeatable work supports a wide span. Knowledge work that needs coaching and review doesn't. The working rule: the more guidance each person needs, the narrower the workable span. The problem isn't the number. It's that most companies don't know their number at all.
Managers absorb the structural cost first
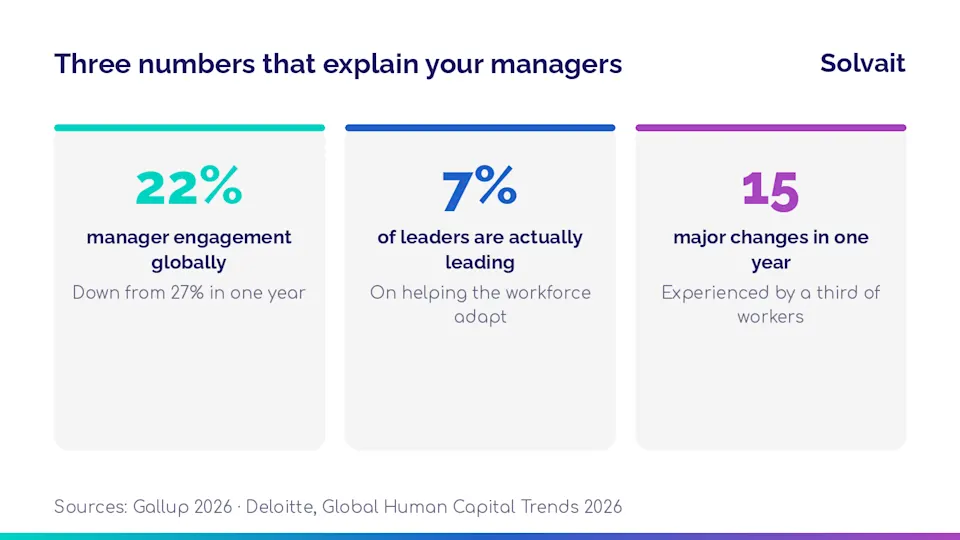
Structural strain shows up in managers before it shows up in results. Gallup's State of the Global Workplace 2026 records manager engagement falling from 27% to 22% in a single year, the steepest decline of any employee group. The engagement premium managers used to hold over the people they lead has almost disappeared.
Deloitte's 2026 Global Human Capital Trends found that one third of surveyed workers went through 15 major organizational changes in a single year, while only 27% say their organization manages change well. The layer absorbing all that change is the same middle management layer that gets cut first in most efficiency conversations.
Which points at a real paradox. Removing a management layer looks like a budget saving, and six months later it reads as slower decisions and higher attrition. Delayering without redistributing authority moves the load. It doesn't remove it.
The chart doesn't lie, but it lags
An org chart describes decisions made in the past: a promotion here, a resignation patched by moving a team under a different manager, a department created for a project that ended. After two years of small decisions, the company is designed by accident rather than intent.
Three symptoms that your structure accumulated rather than got built:
Identical job titles carrying completely different responsibilities from one department to the next.
A manager supervising a function they have no background in, because somebody had to.
Work that passes three approvals, two of which haven't rejected anything in a year.
An agent is useful here precisely because it ignores titles and reads data: who reports to whom, how many reports each manager carries, how roles and tasks are distributed, and where two units are duplicating the same work. Then it proposes an alternative and estimates the effect per department before you move a single person.
Four steps to review your structure this quarter
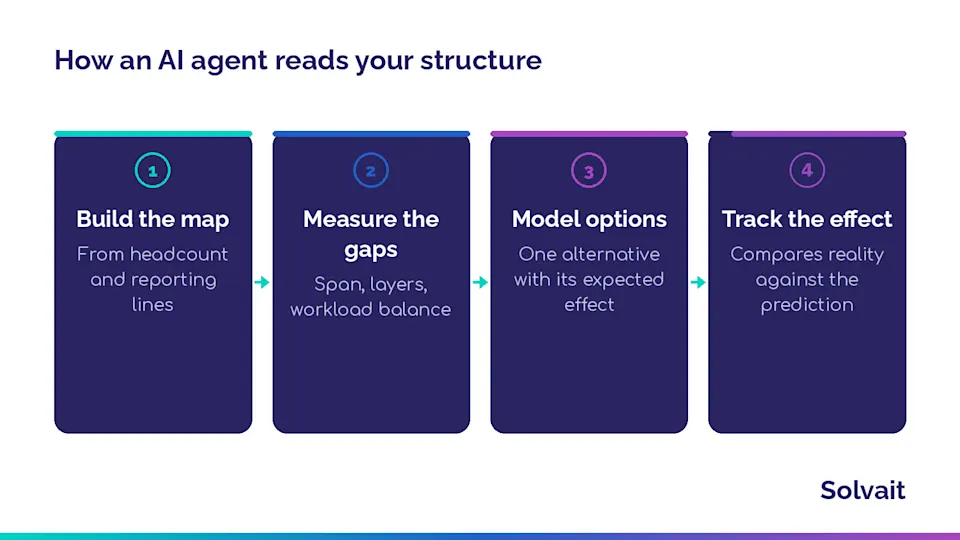
1. Build the real map: Not the approved PowerPoint. The map extracted from live headcount data: reporting lines, titles, start dates, departments.
2. Measure three indicators only: Average span per level, layers to the front line, and headcount per department relative to its workload. Three indicators surface most of the dysfunction.
3. Test one alternative: Don't redesign the company. Take the department with the worst indicators, model one alternative, and calculate its effect on span and workload balance.
4. Check the effect at 90 days: Compare what happened against what the analysis predicted. Did decision time improve? Did turnover in that department fall? An analysis nobody measures becomes an opinion.
Where Solvait fits
Solvait Wise is a standalone performance and talent platform that works alongside your existing HR system rather than replacing it. The organization structure editor renders your chart interactively from live data, and the AI suggested org optimizations module highlights supervision overload zones and proposes alternatives with a practical action plan. The decision stays with you and your managers. The agent removes the weeks of manual analysis in front of it.
For a lighter start, run a role through the free appraisal goal generator and turn it into five SMART goals in 30 seconds. You'll quickly notice which roles in your company are hard to describe in outcomes. Those are usually the same roles blurring your structure.
To see this analysis run on your own data, book a Solvait demo .
FAQ
What is a good span of control?
There isn't one number. Standardized repeatable work supports a wide span, while knowledge work needing continuous coaching and review needs a narrower one. What matters is knowing your current span per level, and being able to explain the differences between departments by the nature of the work rather than by accident.
How does AI analyze an org structure?
It reads live workforce data: reporting relationships, direct report counts, roles and task distribution. It then measures that against indicators such as span, layer count and workload balance, and surfaces the imbalances with alternative scenarios and their expected effect. The final call stays human.
Does removing management layers always improve performance?
No. Cutting a layer without redistributing authority pushes the load upward and lengthens decision time instead of shortening it. Successful delayering always comes with explicit delegation of who decides what, and up to what limit.
How often should we review the structure?
A light quarterly review on three indicators, and a deeper one whenever something material changes such as rapid growth, a merger, or a new line of business. An annual review alone finds problems after their cost has already been paid.
References
Gallup: State of the Global Workplace 2026 , 2026 (manager engagement falling from 27% to 22%)
Deloitte: 2026 Global Human Capital Trends , 2026 (15 major changes, 27% manage change well, 7% leading on adaptability)
McKinsey & Company: The vital but vanishing role of middle managers , 2021 (spans and layers methodology)
McKinsey & Company: The state of AI in 2025 , 2025 (62% of organizations experimenting with AI agents)
SHRM: State of AI in HR 2026 , 2026 (AI adoption patterns inside the HR function)
See agentic HR in action
Solvait AI HR and its agents prepare Saudi labor-law work so HR can review it before anything is submitted.
Tags
Related Posts

Solvait Wise 30 Day Action Plan: How It Works
How Solvait Wise turns org structure insight into a practical 30 day action plan: with sourced numbers and clear steps.
Aug 6, 2026
How AI Spots Org Bottlenecks Meta
How AI reads your org chart and surfaces the broken span of control before it costs you.
Jul 30, 2026

Are Your Job Roles Actually Designed for the Work? Solvait
Most job roles accreted over time; they were never designed. A guide to the difference between a designed role and an accreted one, and how AI detects the mismatch between tasks and competencies.
Aug 20, 2026