
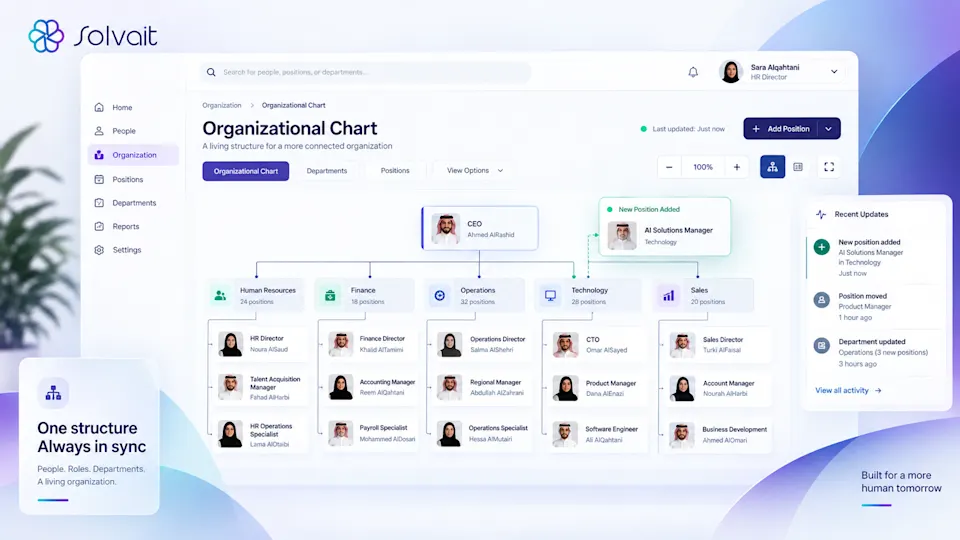
How to Map a Clear Org Structure in Wise's Interactive Org Chart
An org structure is the formal map of how a company splits into departments, positions and jobs, and who reports to whom. Wise's interactive org chart from Solvait turns that map from a static file you forget in a week into one living structure: you create the departments, define the positions inside each one, and link every job to the person who holds it, so the chart updates itself the moment the workforce changes. What you get is a single reliable picture that appraisals, goal alignment and workforce planning can all read from.
Most companies already have an "org chart." The trouble is it's usually an old slide in a folder on someone's laptop, and it doesn't show the last three resignations or the department that spun up last quarter. This guide covers why that vagueness costs you real money, how to map an accurate structure step by step, and how to keep it alive instead of letting it rot again.
Why does an unclear org structure cost more than you think?
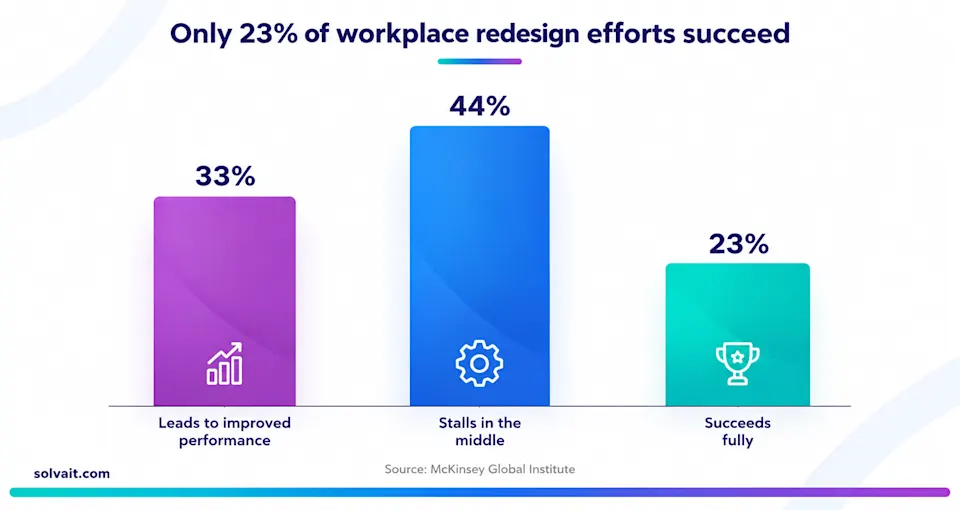
When an employee doesn't know who to route a request to, or Finance thinks a vacant seat is still filled, the price shows up in delayed decisions and stuck approvals, not in a single meeting. And this isn't rare. According to McKinsey's Global Survey, fewer than a quarter of organizational redesigns actually meet their objectives and improve performance. Around 44% stall midway, and a third fail to improve performance after go-live.
Structure isn't a once a decade event either. In the same survey, 82% of executives said they'd lived through a redesign at their current company, and 70% went through one in just the past two years. Structure changes constantly. The real question isn't whether it will change. It's whether you'll know the new shape the same day or a month later.
The global trend adds pressure. Gartner expects top-performing organizations to cut decision-making layers from six to four by 2028, shifting toward product-aligned structures. Yet Gartner also finds fewer than half of CHROs are confident they can meet their organization-design goals. That gap between ambition and execution starts somewhere simple: inaccurate structure data.
In Saudi Arabia there's a clear local layer on top. The Ministry of Human Resources and Social Development reports that more than 2.48 million Saudis have joined the private sector since 2020, with women's labour force participation reaching 36.3% in Q1 2025. Every new hire is a seat filled, sometimes a department that grows. A structure that can't keep pace with that growth becomes a drag on compliance and planning rather than a record that supports them.
Measurement suffers too when the structure is fuzzy. Deloitte's 2024 Global Human Capital Trends research, covering 14,000 leaders across 95 countries, found only 3% of organizations consider themselves highly effective at capturing the value their people create. It's hard to measure a team whose boundaries you can't see.
How do you map your org structure in Wise's interactive org chart?
Building the structure in Wise follows four ordered steps: define the departments, then the positions inside them, then link jobs to people, and the living chart generates itself. You work top down, not the other way around.
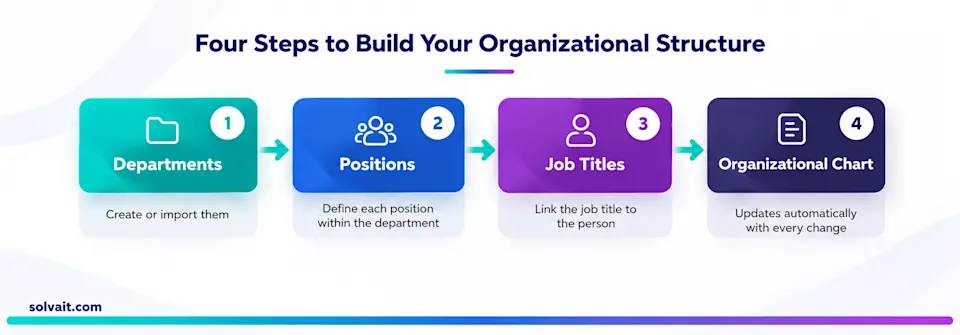
Set up your departments: Create departments and sub units by hand in the structure editor, or import them in one batch if they already live in a file or another system. Importing saves hours when you're starting with hundreds of employees.
Define the positions inside each department: A position is the seat itself, separate from whoever sits in it. Defining positions first means a vacancy stays visible on the chart even after the person leaves, and that's exactly the planning signal that disappears in static files.
Link the job to the person: Assign each job to an employee and set the reporting line. This is where the chart earns its meaning: who leads whom, and where an approval travels.
Publish the live chart: Once the three steps are done, Wise's interactive org chart renders the full structure and updates automatically with any later move, hire or exit.
The real difference isn't how the chart looks. It's that the chart is connected to employee data rather than drawn on top of it. And here it's worth being honest.
When is a simple drawing tool enough?
If all you want is a picture for a one off slide, a drawing tool or a spreadsheet does the job fine, and you don't need a platform. The difference shows the moment something changes. A static drawing stays as it is until you redraw it by hand, while a structure inside the platform updates with the event itself and stays one source that appraisals, goals and compliance all read from. The table below sums up when each is enough:
Criterion | Drawing tool or sheet | Structure in the platform |
Fine for a one off picture | Yes | Yes |
Updates on every change | No | Yes |
Connected to employee data | No | Yes |
One view across subsidiaries | No | Yes |
Feeds appraisals and goal alignment | No | Yes |
The practical rule: if the structure will change, and if someone will make a decision from it, it deserves to be live rather than drawn.
How do you keep the chart accurate and turn it into decisions?
Drawing the structure once is the easy part. Keeping it honest six months later is what separates a useful tool from another dead file. Because the structure in Wise is tied to employee data, a hire, transfer or exit shows up on the chart without a redraw, and that alone removes the biggest source of structure drift.
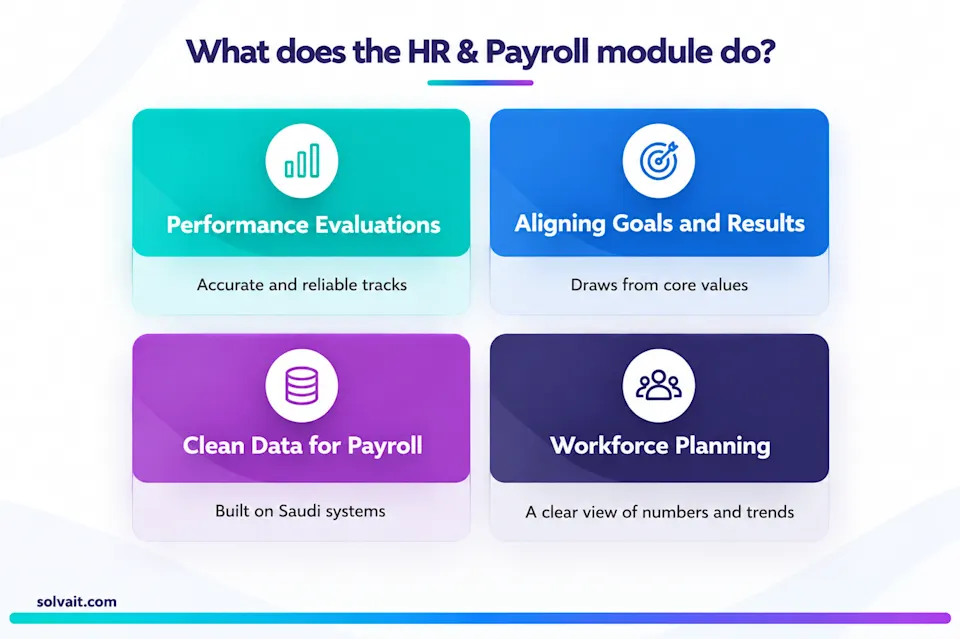
An accurate structure isn't the goal in itself. It's the infrastructure other decisions run on. Appraisal approval routes follow the reporting lines on the chart. OKRs cascade top to bottom through the same departments. Workforce planning starts from a clear view of headcount and vacancies. Compliance and payroll systems read from this structure as the clean base they depend on, though the Saudization, Nitaqat and GOSI logic itself sits inside Solvait AI HR rather than Wise.
For groups running several subsidiaries, Wise offers one view across entities: consolidated org charts, goals and analytics at the group level, while each entity keeps its own data. That single view is hard to pull off with a separate file per company.
The mistake almost everyone makes
The most common error is drawing the structure around people instead of positions. When you tie the structure to an employee's name rather than the seat, the chart collapses the moment they leave, and the vacancy vanishes from your numbers. Define the position first, then seat the person in it. That keeps the empty seat visible to anyone planning to hire, and keeps the chart correct even during high turnover.
Where Solvait Wise fits
Solvait Wise is a standalone performance, talent and OKR platform that strengthens your existing HR system rather than replacing it. Its structure module brings together the org chart and the structure editor: departments, positions and jobs, with one batch import and a multi subsidiary view. Because that structure is clean and current, Solvait HCM reads employee and payroll data from a base it can trust.
The practical payoff is speed. Solvait reports that its clients go live within 30 days and that more than 260 organizations across Saudi Arabia and the Gulf run on its solutions. A live structure isn't a cosmetic feature. It's the starting point that lets the rest of the system work with confidence.
If you want to see what a live structure looks like with your own data, book a demo with the Solvait team and we'll show you how it's built and kept accurate in your organization.
Frequently asked questions
What is the difference between an org structure and an org chart?
An org structure is how an organization divides into departments, positions and reporting lines. An org chart is the visual representation of that structure. In Wise's interactive org chart the two match: what you see is the real structure linked to employee data, not a separate drawing that goes stale.
How do I build an org structure in Wise?
In four steps: create or import your departments, define the positions inside each department, then link jobs to people and set reporting lines. The living chart is generated from that and updates automatically with any later change.
Does Wise calculate Saudization or GOSI from the structure?
No. The Wise structure module handles departments, positions, jobs, the chart and the multi entity view. Nitaqat, Saudization and GOSI logic sits inside Solvait AI HR, which reads from the same clean structure data.
Can I see several subsidiaries in one place?
Yes. Wise provides a consolidated group level view that brings together org charts, goals and analytics across subsidiaries, while each entity keeps its own data separate.
References
McKinsey: Getting organizational redesign right, 2016 (backs: fewer than a quarter of redesigns succeed, 44% stall, a third fail to improve performance. Canonical figure).
McKinsey: The secrets of successful organizational redesigns: Global Survey, 2014 (backs: 82% experienced a redesign, 70% within the past two years).
Gartner: Organization Design for CHROs: Leading Change in the AI Era, 2025 (backs: decision layers cut from six to four by 2028, fewer than half of CHROs confident in meeting design goals).
Gartner: HR Leaders Survey: Top Priorities, 2023 (backs: nearly 90% say career paths are unclear, employers rethinking org charts).
Deloitte: 2024 Global Human Capital Trends: Human performance, 2024 (backs: 14,000 leaders across 95 countries, only 3% highly effective at capturing value).
Ministry of Human Resources and Social Development: Progress in the Saudi Labor Market, 2025 (backs: 2.48 million Saudis in the private sector since 2020, women's participation 36.3%).
Ready to see Solvait in action?
Book a personalized demo and see how Solvait's AI-powered HR platform can transform the way your team works.
Tags
Related Posts

Vision 2030 Is Rewriting the Saudi HR Stack
Vision 2030 changed Saudi Arabia's labour market and compliance faster than legacy systems can keep up. Why Saudi CHROs have to rethink the HR stack now.
Sep 21, 2026
AI CV Screening: How It Ranks Arabic and English CVs
How AI CV screening reads Arabic and English CVs, scores each applicant with strengths and gaps, and what Saudi recruiters should still decide themselves.
Sep 17, 2026
Agentic AI in HR: What "Self Running HR" Really Means
Agentic AI in HR means AI agents execute HR work under human oversight. Here is what that changes for Saudi HR teams, and what it does not.
Sep 16, 2026